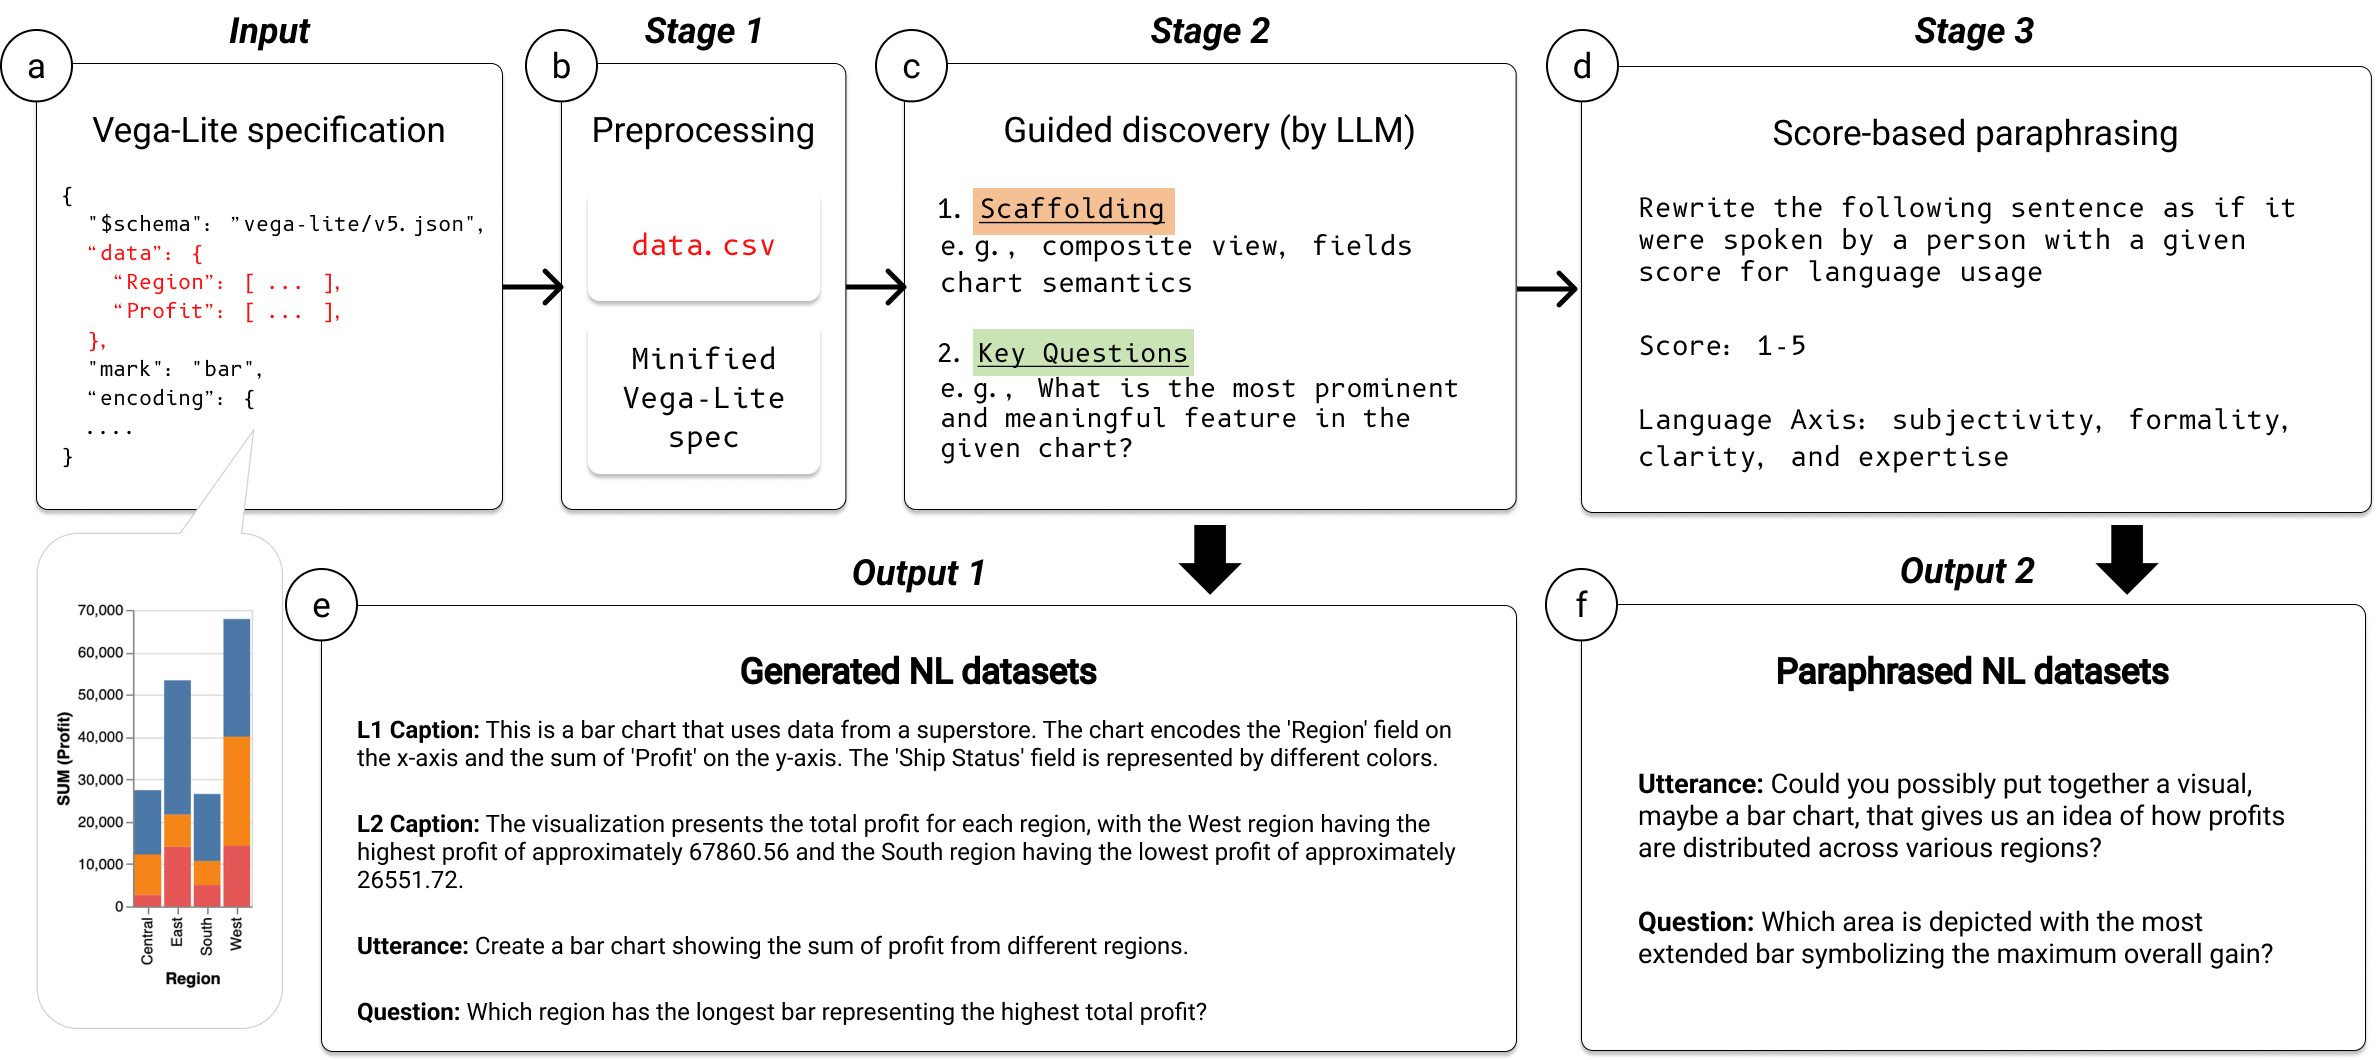
We introduce VL2NL, a Large Language Model (LLM) framework that generates rich and diverse NL datasets using Vega-Lite specifications as input, thereby streamlining the development of Natural Language Interfaces (NLIs) for data visualization. To synthesize relevant chart semantics accurately and enhance syntactic diversity in each NL dataset, we leverage 1) a guided discovery incorporated into prompting so that LLMs can steer themselves to create faithful NL datasets in a self-directed manner; 2) a score-based paraphrasing to augment NL syntax along with four language axes. We also present a new collection of 1,981 real-world Vega-Lite specifications that have increased diversity and complexity than existing chart collections. When tested on our chart collection, VL2NL extracted chart semantics and generated L1/L2 captions with 89.4% and 76.0% accuracy, respectively. It also demonstrated generating and paraphrasing utterances and questions with greater diversity compared to the benchmarks. Last, we discuss how our NL datasets and framework can be utilized in real-world scenarios.
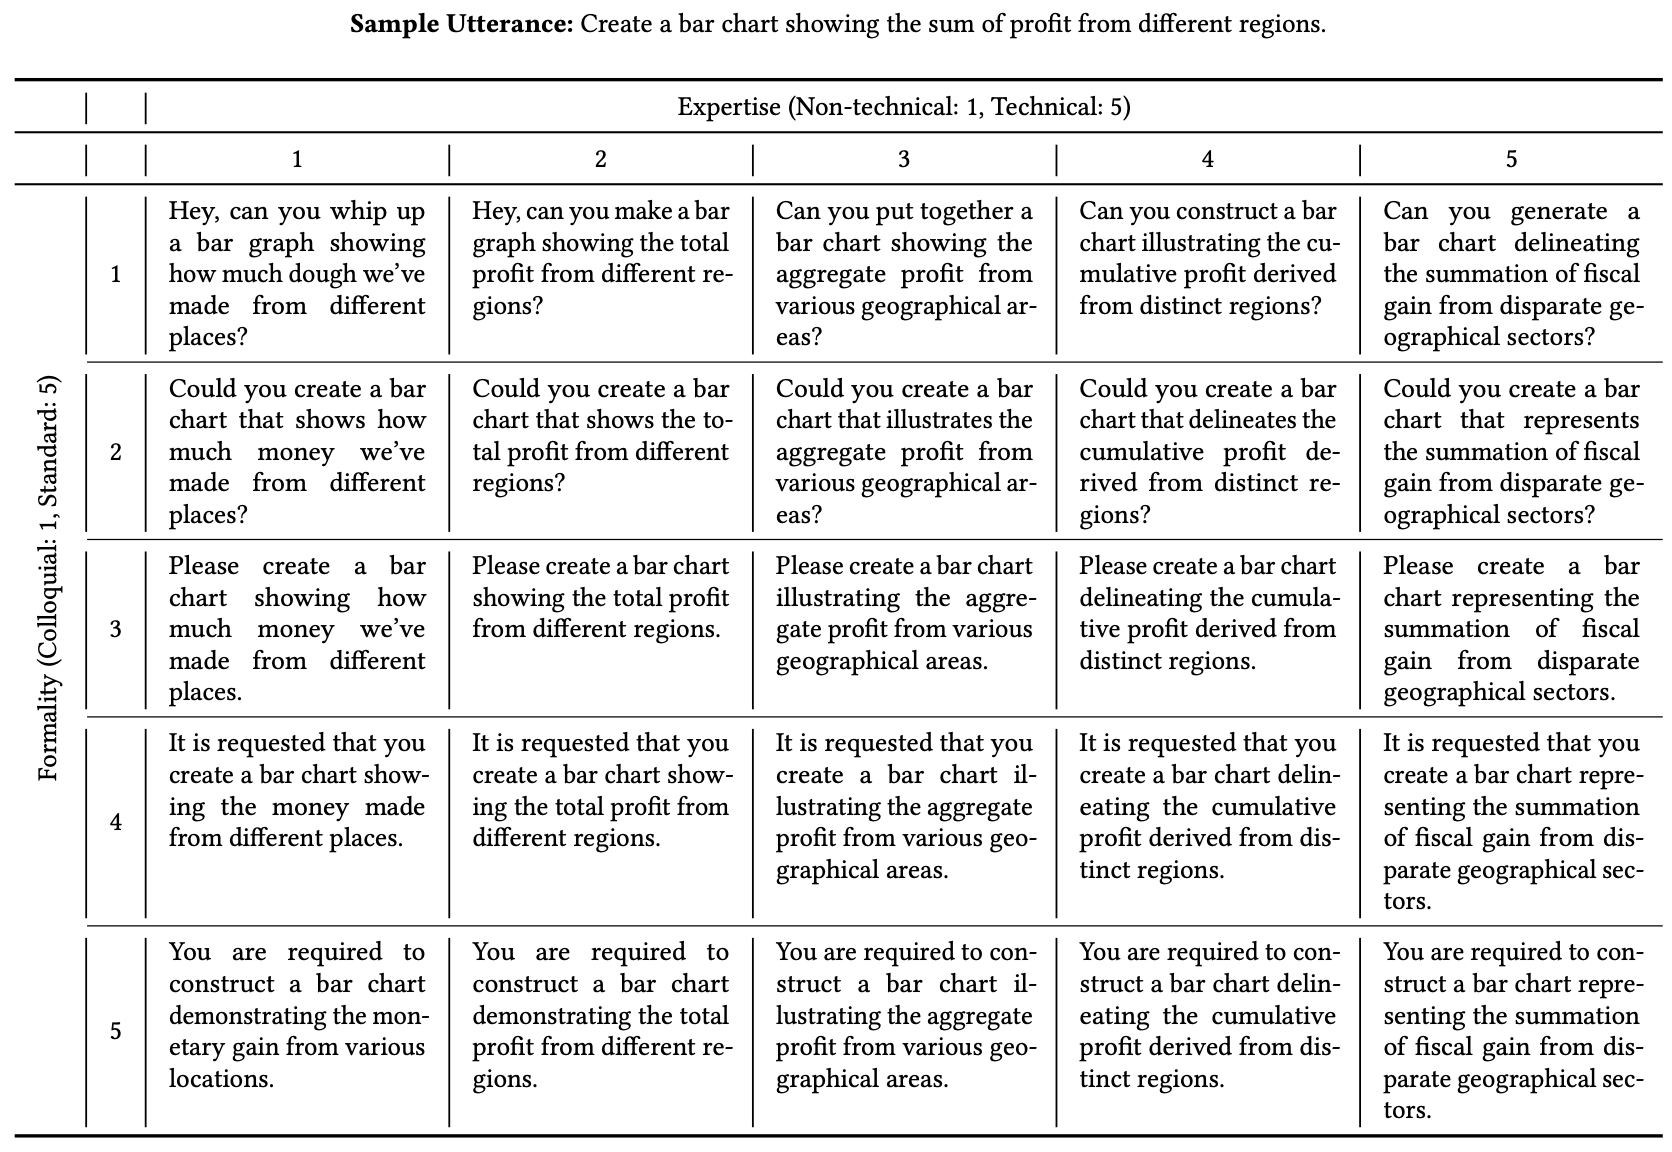
Our paraphrasing technique is inspired by a linear interpolation in the latent space for image generation and manipulation as demonstrated in many system and application papers. It enables a smooth transition from one expression to another by focusing on creating controllable and meaningful variations of a single sentence. We employ a five-point Likert-scale and assign one of the axes to each. Here, we focus on altering only the sentence's syntax, while maintaining its meaning. In detail, we provide LLMs with a sentence (i.e., Example Sentence) and an explanation about one of the defined axes (i.e., Axis) and its two directions (i.e., Direction-1, Direction-2). We assign a specific value on a Likert scale ranging from one to five, to paraphrase the sentence as if it were spoken by a person using a language with a certain degree indicated by the score.
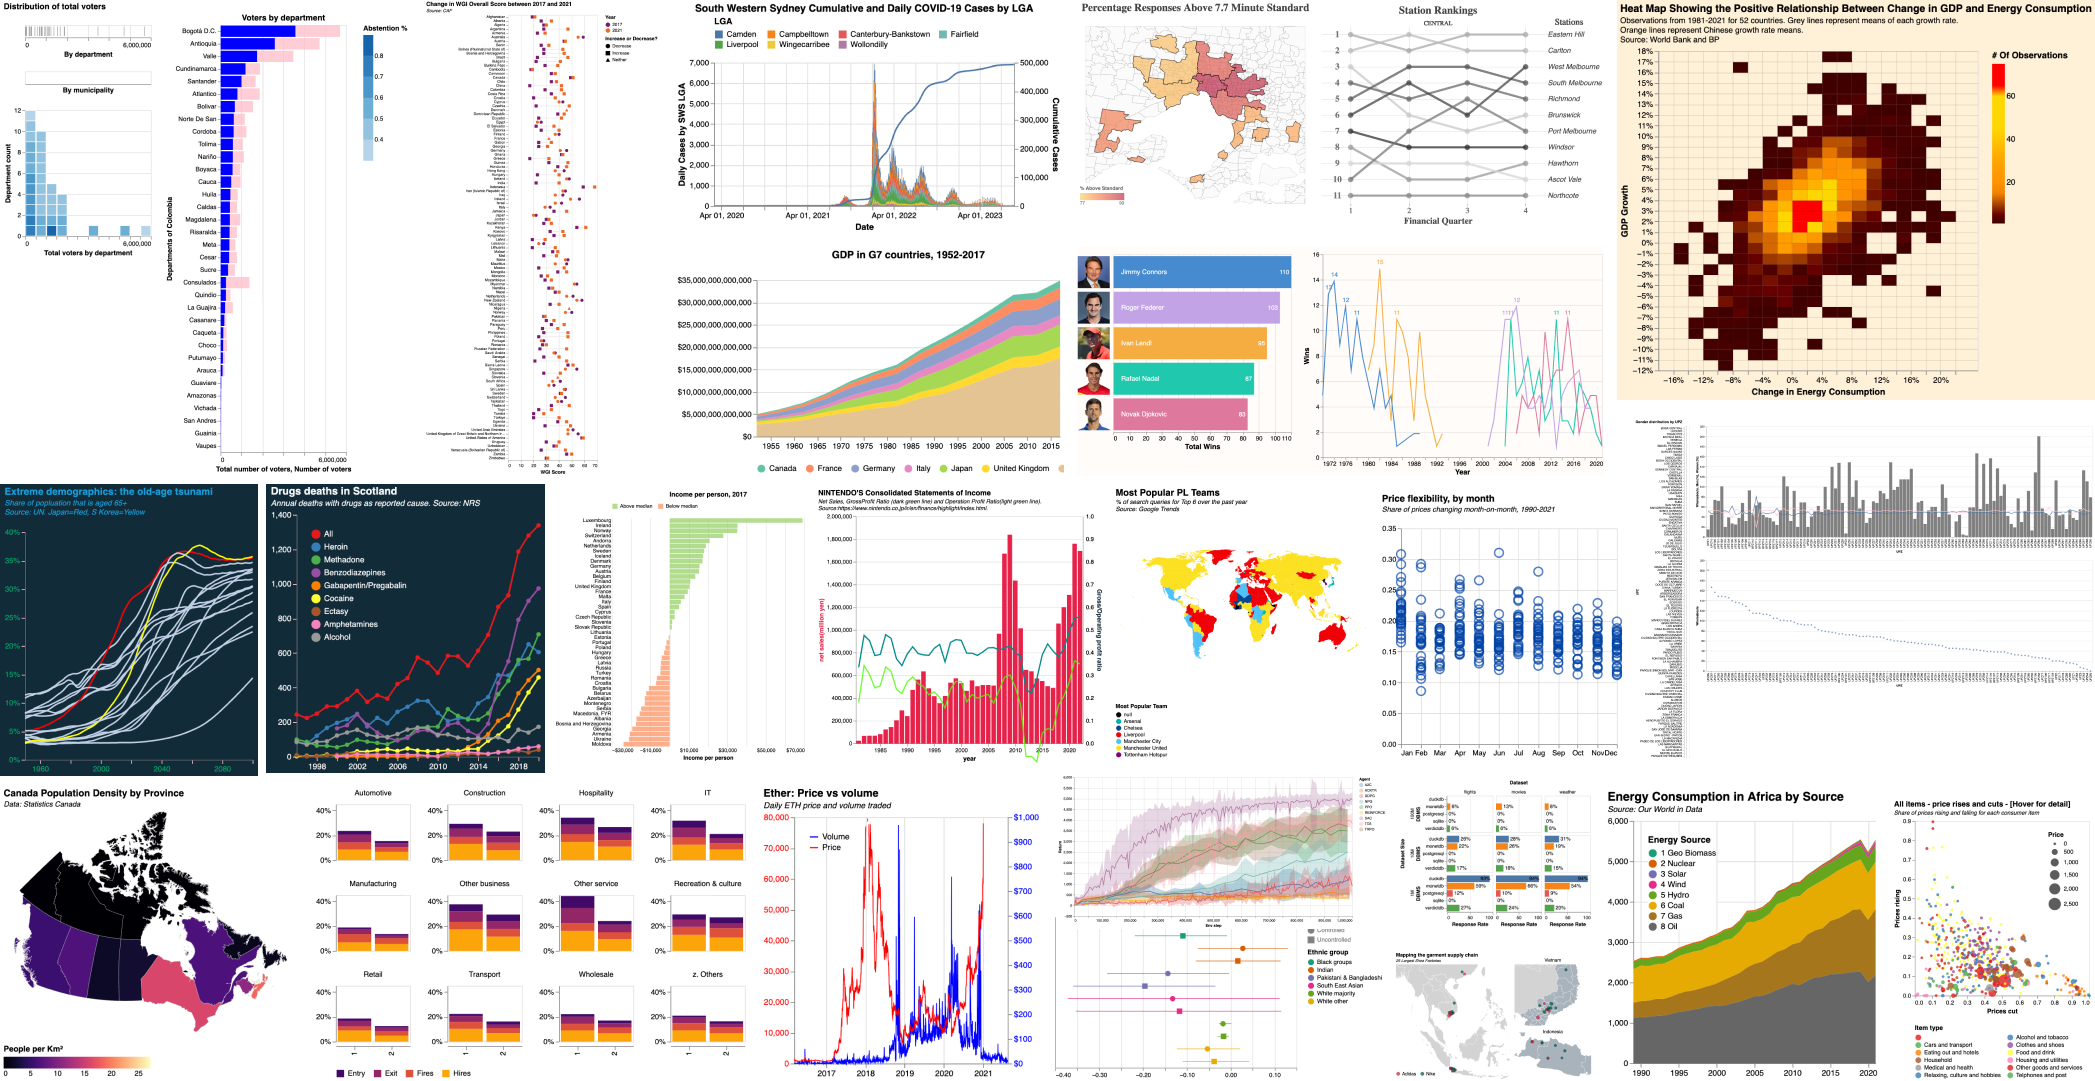
Types of NL Datasets
L1 Caption
It contains elemental and encoded properties of the visualization (i.e., the visual components that comprise a graphical representation's design and construction).
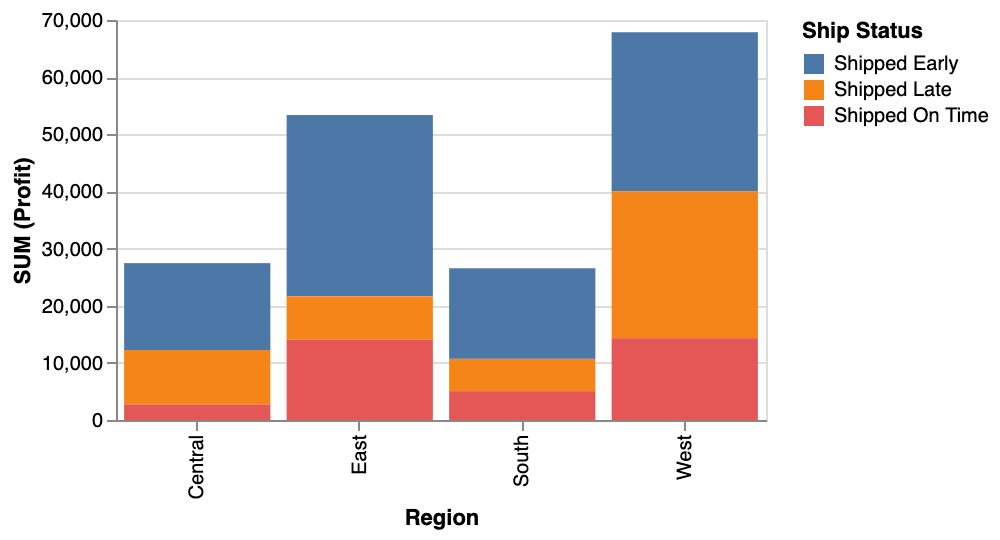
e.g., This is a bar chart that uses data from a superstore. The chart encodes the 'Region' field on the x-axis and the sum of 'Profit' on the y-axis. The 'Ship Status' field is represented by different colors.
L2 Caption
It contains statistical and relational properties of the visualization.
e.g., The visualization presents the total profit for each region, with the West region having the highest profit of approximately 67860.56 and the South region having the lowest profit of approximately 26551.72.
Utterance
An utterance is what a user would say to generate a given chart. There are three types of utterances.
e.g., Create a bar chart showing the sum of profit from different regions.
Question
Questions are used to analyze charts and elicit high-level decision. There are different types of questions.
e.g., What is the Sum(profit) of Central region?
Sentence Paraphrasing Example (Formality score: 3)
e.g., Create a bar chart showing the sum of profit from different regions.
Please create a bar chart illustrating the aggregate profit from various geographical areas.
@misc{ko2023natural,
    title={Natural Language Dataset Generation Framework for Visualizations Powered by Large Language Models},
    author={Hyung-Kwon Ko and Hyeon Jeon and Gwanmo Park and Dae Hyun Kim and Nam Wook Kim and Juho Kim and Jinwook Seo},
    year={2023},
    eprint={2309.10245},
    archivePrefix={arXiv},
    primaryClass={cs.HC}
}